Mid-Year Market Performance Review
1. International Markets: Tech-Heavy Asia Rules, Broad Moderation Elsewhere
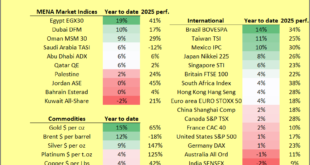
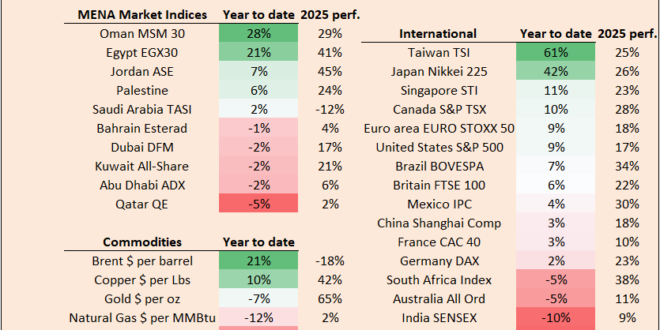
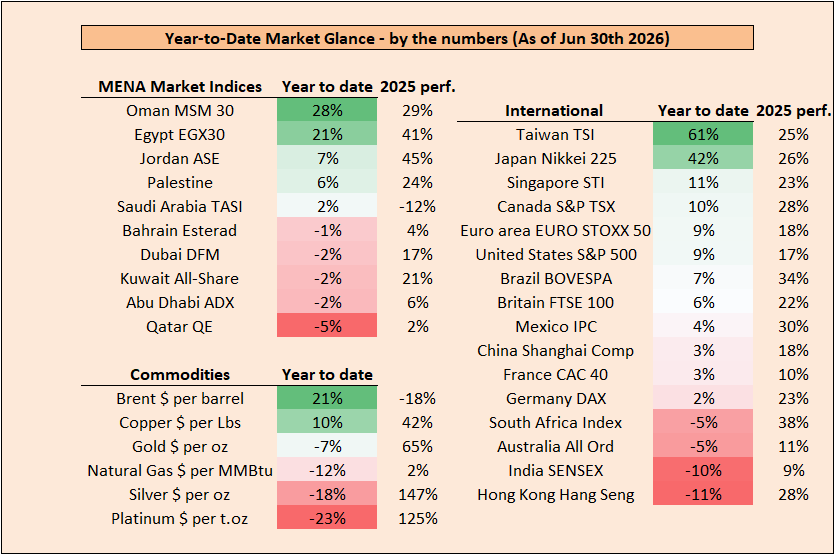
Global equity performance is heavily bifurcated, dominated by semiconductor and hard-tech supply chain hubs, while western indices show highly synchronized, moderate growth.
The Semiconductor Surge: Taiwan (TSI) is the absolute standout global performer at 61% YTD, up from 25% in 2025, riding the explosive wave of global hardware and AI infrastructure demand. Japan’s Nikkei 225 follows closely at 42% YTD, accelerating significantly from its 26% return in 2025.
The Western Uniformity: The U.S. S&P 500 has advanced to a modest 9% YTD (up from +1% in February but a step down from 17% in 2025). This performance is tightly locked with other Western indices, including Canada’s TSX (+10%) and the Euro Stoxx 50 (+9%).
Severe Global Reversals: Markets like India (SENSEX) and Hong Kong (Hang Seng) have experienced severe pullbacks, down -10% and -11% YTD respectively, erasing their previous momentum.
2. The Regional MENA Split: Local Realities
The MENA region shows a massive split between energy-importing/diversifying economies and major GCC heavyweights, a sharp pivot from the broad gains seen in 2025.
The High Flyers: Early in the year, Egypt (EGX30) was leading global charts at +19%; it has maintained that momentum to close the half at +21% YTD. Oman (MSM 30) has taken the regional crown with an incredible 28% YTD.
The Steady Ground: Local growth has cooled significantly elsewhere. Jordan (ASE) clawed up from flatlining at 0% to a modest 7% YTD, representing a sharp deceleration from its stellar 45% return in 2025.
The GCC Slump: Heavy-weight GCC markets have completely reversed their 2025 gains, with Saudi Arabia (TASI) eking out a minor 2% YTD, while Abu Dhabi (ADX) slid to -2% and Qatar (QE) dropped to -5% YTD.
3. The Precious Metal Breather
Safe-haven asset classes have taken a cyclical breather after their historic multi-year runs.
Gold sits at -7% YTD, taking a rest after a massive 65% performance in 2025.
Silver has dropped -18% YTD following its massive 147% surge in 2025, while Platinum is down -23% YTD.
Re-Evaluating the Macro Outlook
The driving forces behind these numbers reveal that the crosscurrents we identified in February have drastically intensified. Here is how our structural themes have evolved as we head into the second half of the year.
One: Geopolitical Shocks and the Tale of Two Inflations
Earlier this year, we highlighted the struggle with stubborn inflation in the West and cheap, deflationary exports from the East. Mid-year realities show this friction has shifted from simple tariff wars to severe geopolitical shocks.
The Iran War Shock & Oil’s Reversal: Our early outlook noted that while forecasts suggested Brent crude could slide to $55, it was showing “resilient strength.” That strength exploded into a full-blown shock. The outbreak of conflict in the Middle East severely disrupted border flows and supply chains through the Strait of Hormuz. As a result, Brent crude skyrocketed to a blistering 21% YTD gain (a massive pivot from its -18% drop in 2025), keeping global inflationary pressures alive.
The Deflationary Buffer: China’s strategy of exporting “cheap goods” has kept a ceiling on consumer electronics and manufacturing inputs, preventing a total global inflationary spiral, but localized energy and supply-chain pressures remain highly volatile.
Two: Central Bank Gridlock and the Delayed Policy Pivot
The “Great Policy Pivot”—our expectation of an aggressive, global central bank easing cycle—has collided head-on with these structural macro realities. The pivot has turned into a strategic pause.
The Fed’s Hold: Faced with a stagflationary threat, the U.S. Federal Reserve has completely frozen rate cuts for the remainder of 2026. Futures markets have pushed modest easing into 2027.
The Dollar and the Yield Premium: Despite the Fed’s pause, the narrowing transatlantic yield premium—as the ECB and BOJ adopt hawkish operational stances—means the fundamentally overvalued U.S. Dollar is still poised to resume its structural downward trend by year-end, preserving the long-term potential for an international “currency kicker.”
The Great AI Capex Surge—Hardware Hegemony
The AI narrative has accelerated far beyond the “inefficient spending” and corporate debt issuance phase we monitored in February. The market has violently separated the builders of AI from its adopters.
The Hard-Tech Winners: As visualized in the performance of Taiwan and Japan, the market is aggressively favoring hardware. This is hard tech masking broader macroeconomic sluggishness.
The Software and Hyperscaler Drag: Conversely, the enterprise software giants and hyperscalers funding this massive capex have experienced steep valuations contractions as the market demands immediate proof of software-level monetization.
Strategic Bottom Line for H2 2026
In February, we noted that Gold was struggling to confidently cross the psychological $5,000/oz mark, though it remained the ultimate long-term hedge.
This mid-year correction is healthy and reflects short-term liquidity preservation during the peak of the March-April war scare. With global debt expanding and fiat confidence fracturing, the fundamental thesis behind the “Golden Hedge” remains entirely intact for the macro horizon.
The mid-year data reinforces our core thesis: selection over momentum.
As structural headwinds mount, passive market indexing will likely yield flat-to-negative real returns when adjusted for sticky inflation. Winners are localized and idiosyncratic. To insulate capital against systemic shocks, alpha is found by rotating into hard technology manufacturing hubs (like Taiwan and Japan), capturing localized growth stories in the MENA region (like Oman and Egypt), and accumulation of the “Golden Hedge” (Gold and Silver) at these fundamentally discounted mid-year entry points.
As the financial world keeps moving, it’s super important to know how your investments are doing. If your portfolio is worth more than $100,000, don’t hesitate! Contact us today at Al Hiary Al-Iktissadi. We’re offering a free look at your portfolio to help you understand your current situation and find smart ways to grow your money. Let’s make your investments work harder for you!